Creating heat maps in CoGIS
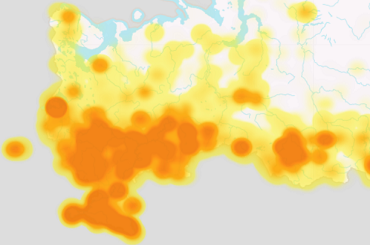
On-the-fly creation of heat maps based on vector data for visual data analysis
The heat maps are used for visual spatial analysis, the result of which is a raster surface created on-the-fly.
All calculations and surface construction are performed by GIS server of CoGIS and not in the user’s browser. Firstly, it allows you to process large datasets with good performance and obtain analysis results in a time that is convenient for the user, and secondly, this functionality is immediately available in mobile application CoGIS Mobile and in any other web applications which use REST API of the GIS server.
The basis for calculation and construction of spatial analysis surfaces is a point feature class or a representation of polygon feature class as polygon centroids.
What is a heat map?
A heatmap is a graphical representation of data that uses a system of color coding to represent different values. As heat map shows distribution of points, it works best for large numbers of points where their symbols overlap. At that, the result depends not only on the points density but also on their characteristics.
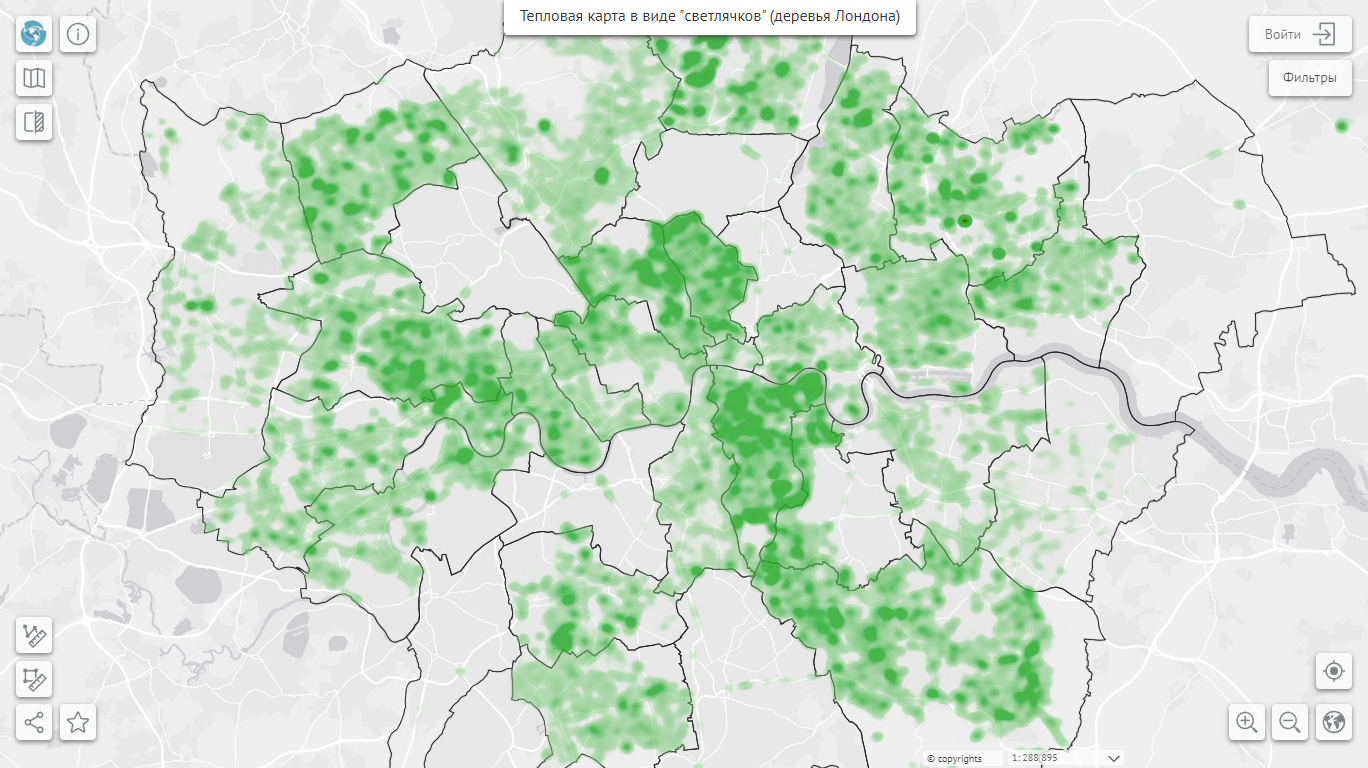
Visually, the heat maps show the relative density of points as a dynamic raster image using the color coding scheme.
Each pixel in the output raster has the value defining the relative density. The density is based on the number of objects located close to each other and on the expression built by the object’s attributes which imposes additional weights when coloring the raster. For example, the heat map values of point features representing settlements can be weighted according to population size so that settlements with larger populations contribute more to the density calculation.
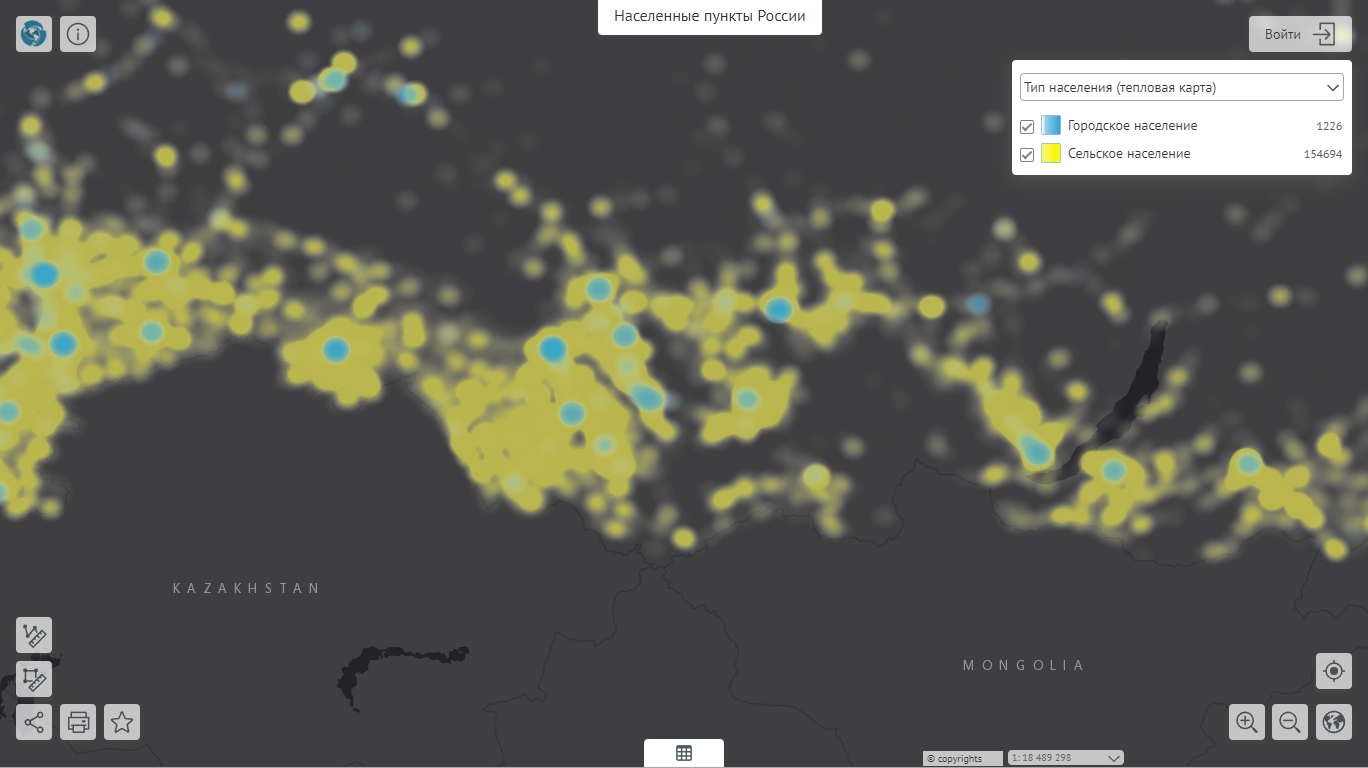
Calculation algorithms
The main principles of constructing raster surface when calculating the heat map values are as following:
- Search for objects by specified extent considering filters
- Transfer of point features coordinates and field values to the calculation algorithm to calculate the numeric value for each pixel
- Conversion of numerical value for each pixel to specific color of the color coding scheme set in the map project.
The result of the algorithmic calculation is the numeric value in each pixel. The basis of the calculation is the weight function (kernel) used to estimate distribution and parameters (kernel density estimation, kernel regression).
The algorithm of calculating color for each pixel of the generated map image is as following:
-
To each object the size expression is assigned, i.e., the influence radius and the weight expression, i.e., the weight as the maximum value in the point of the object
-
size expression is set in millimeters, though it is possible to use the scale dependency option via the @map_scale macros (when zooming in the image is stretched, i.e., the size of the circles in meters on the ground, and not in pixels at any scale)
-
weight expression – this is a coefficient for the object, without it, the weight of each object is considered as 1 until normalization is performed
-
-
around each point on the pixel basis, the distribution function is built according to specified kernel function, which gives the numerical distribution in a given radius with values from 0 to a specified weight
-
values are summed for each pixel (by weight overlap of multiple objects)
-
next, the values are normalized (linearly or logarithmically) for conversion of values from minimum (not necessarily 0!) to maximum in the range from 0 to 1, respectively.
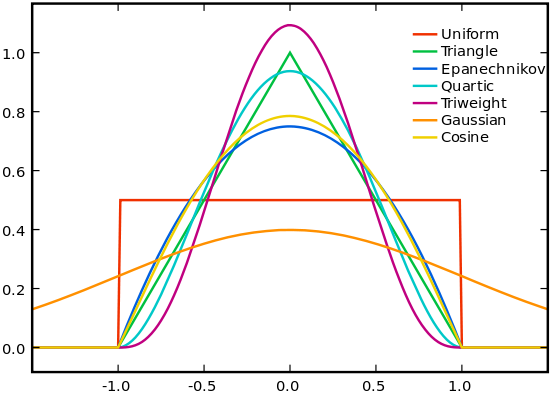
For density calculation the following weight functions are used, which can be defined as parameter when setting the layer properties:
- Uniform (by default) - linear
- Triangular
- Epanechnikov
- Quartic
- Triweight
- Tricube
- Cosine
One of the most important steps of the heat map construction is the normalization of values according to selection of the currently processed data, the selection of which is influenced by custom filters, current map extent, or changes made to the data.
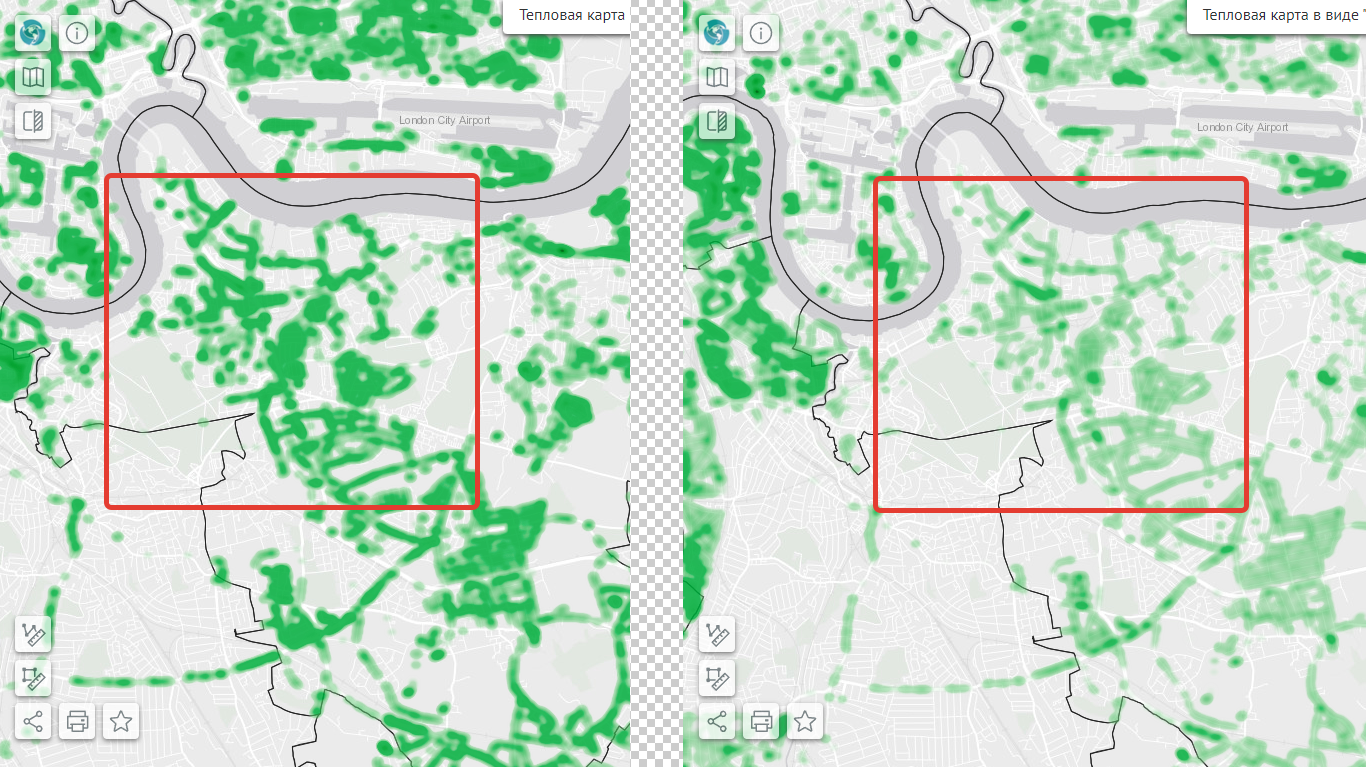
Recalculation of relative density when changing map extent with a shift to the right
The figure above shows that by shift of the map extent to the right, the raster surface was recalculated on the fly due to the normalization of values and a new raster image was output by the GIS server. This allows you to evaluate and analyze data regarding the current state of the map.
For setting the normalization of the weights calculation, a separate parameter is responsible, which can take the following values:
- Linear (by default) – the calculated value is normalized linearly (uniformly)
- Logarithm – the calculated value is normalized by logarithm, the average values are close to maximum.
Another parameter for calculation of the heat map values is the neighbor search radius. To define the neighbor search radius relative to the kernel point, the SQL expression and not a simple value of this radius can be transferred to GIS server.
Display on the interactive map and layer settings
All layer settings for the map service are specified in the QGIS project along with setting symbology and other layer properties.
Selection of the weight function is defined by the additional parameter in the layer settings of the QGIS project.
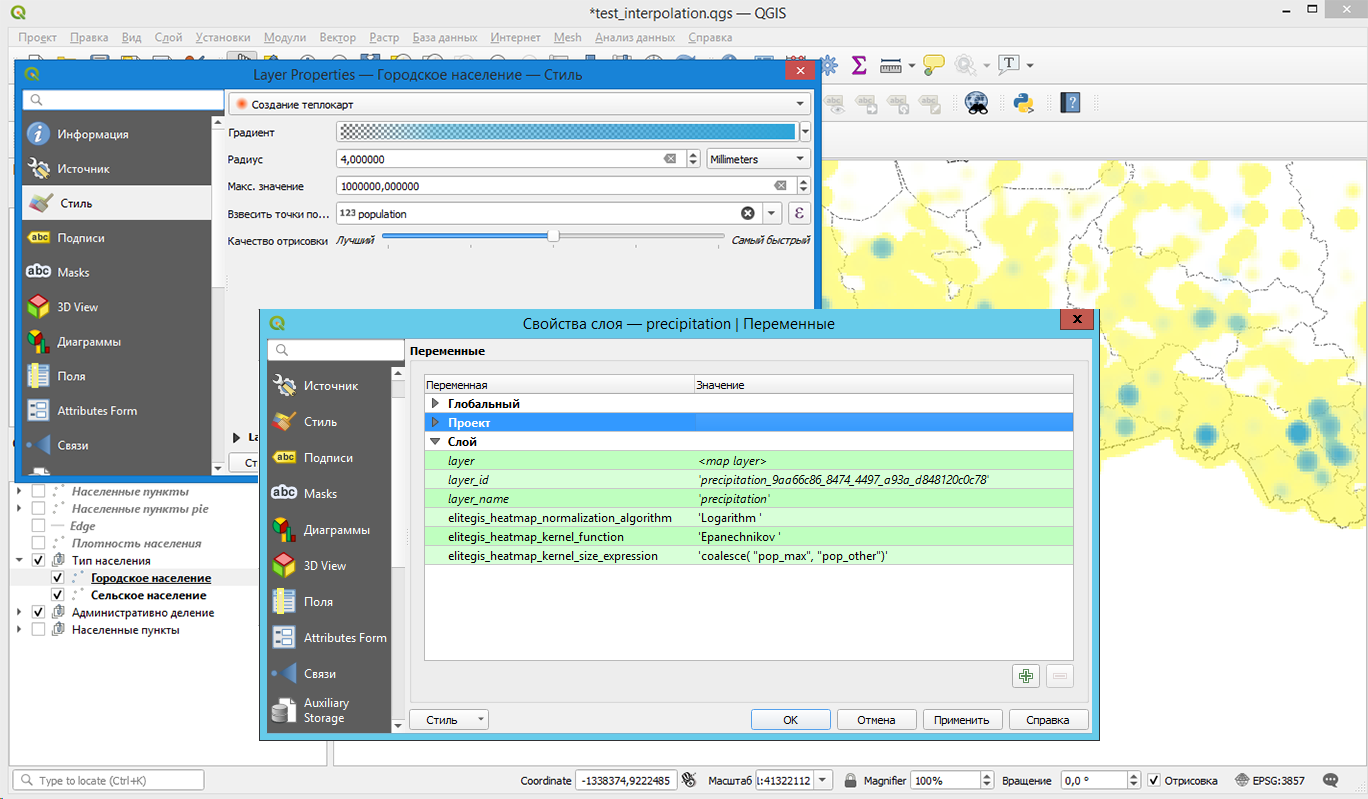
CoGIS does not use the QGIS libraries for calculations or rendering. QGIS is only used as an interface for defining parameters for map service of the CoGIS GIS server, and the qgs project is used as a container for storing these parameters.
According to settings in the qgs file project, GIS server constructs the surfaces in real time, packs the rendered image to the raster format and transfers it to the client's map application for display on the map.
The ability to construct heat maps on the fly allows you to analyze data using the following map tools:
- Attribute and spatial filters
- Change of map scales and extents
- Slider for work with time data
- Tools for data creation/editing/deletion